

POP vs Towers
Viewing this guide for
The sections below describe how to read the Monitoring Dashboard. An example dashboard for Greenville Walmart is shown at the bottom of this page.
- Color Coding: You will see 4 different color codes inside of the dashboard.
- Gray: Informational, does not indicate a status
- Green: Operating nominal/currently online
- Yellow: Standby mode
- Red: Offline/ Severely Degraded from nominal status
- Top Row: A grid of core systems we are monitoring connection to.
- Cloudflare DNS: global DNS manager, used to determine general internet status
- Google DNS: redundant DNS service to Cloudflare
- Walmart DNS: can be used to evaluate local site internet health
- Walmart Gateway: same concept to Walmart DNS
- Zipline Comms Server Reachable: our AWS comms server, can be used to determine cloud comms issues
- Wired WAN Interface: Primary ISP connection for the site
- Cellular WAN Interface: Backup service for site monitoring, Yellow is expected, Green can be seen in some instances and is normal; Red is not expected.
- SpeedTest Values / Internet Uplink Quality
- General Speed Test results such as Download/Upload speeds, Jitter and packet loss
- Site Switch Port Statuses
- A per port breakdown of activity status and connectivity will be labeled on the dashboard tile
Example Dashboard
Section titled “Example Dashboard”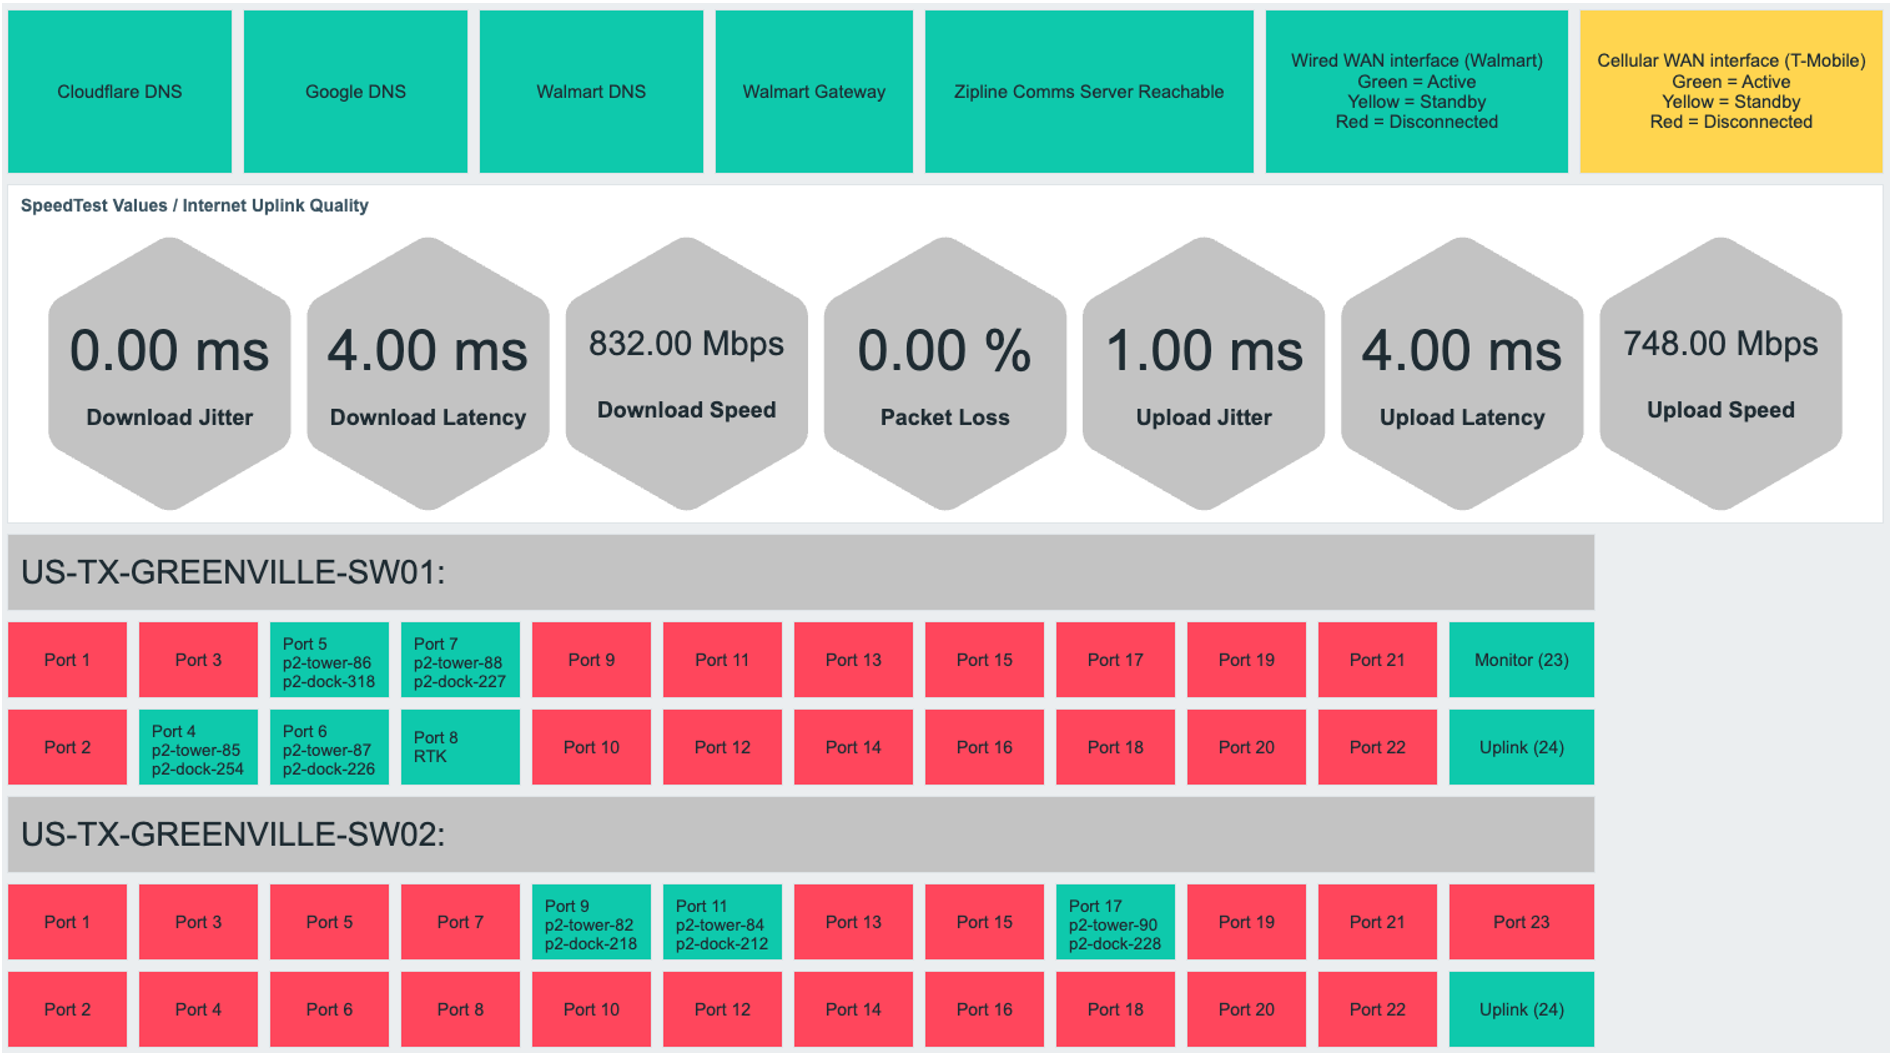
Did this guide help you get unblocked?
Open suggestions
There are no open suggestions.
Open pull requests
There are no open pull requests.