

How to Use This Guide
Overview
Section titled “Overview”This troubleshooting guide is the single source of truth for diagnosing and resolving alarms on Zipline assets. Use this page to find the right guide, work through its troubleshooting steps, and explore the complete troubleshooting flow.
Find a Guide
Section titled “Find a Guide”Find a guide using one of the following methods:
- By alarm code: Use the Alarm Lookup to search by alarm code, alarm name, hex ID, or guide. The lookup shows whether each alarm has a guide and links to covered guides.
- By browsing: Use the sidebar to browse by category.
- By searching: Use the search bar (
Cmd+Kon Mac orCtrl+Kon Windows) to search across all topics.
Use a Guide
Section titled “Use a Guide”Each troubleshooting topic has an interactive decision tree that walks you through the diagnosis step by step:
- Read the background to understand what the alarm means.
- Review the flowchart if helpful to preview the complete troubleshooting paths.
- Follow the steps and perform actions in order.
- Choose the option that matches what you observe.
- Reach an outcome: return the asset to service, determine that maintenance is required, or escalate to the appropriate on-call team.
Some topics have a Software version selection at the top of the decision tree. Select the version range installed on the asset to see the applicable steps.
Click Start over at the bottom of the decision tree to reset it and begin again.
Step Types
Section titled “Step Types”- ACTION: Something to do, such as inspect, run a test, or check a log.
- QUESTION: A yes/no or multiple-choice decision point.
- ESCALATION: Contact a specific on-call team.
- REFERENCE: Supporting information or a linked topic or procedure.
- TELEMETRY: An embedded Baraza plot or live view. Enter the requested mission identifier or Smart Cart address to load the diagnostic view in the page.
Explore the Flowchart
Section titled “Explore the Flowchart”The flowchart provides an optional overview of the troubleshooting paths. It does not replace the interactive troubleshooting steps.
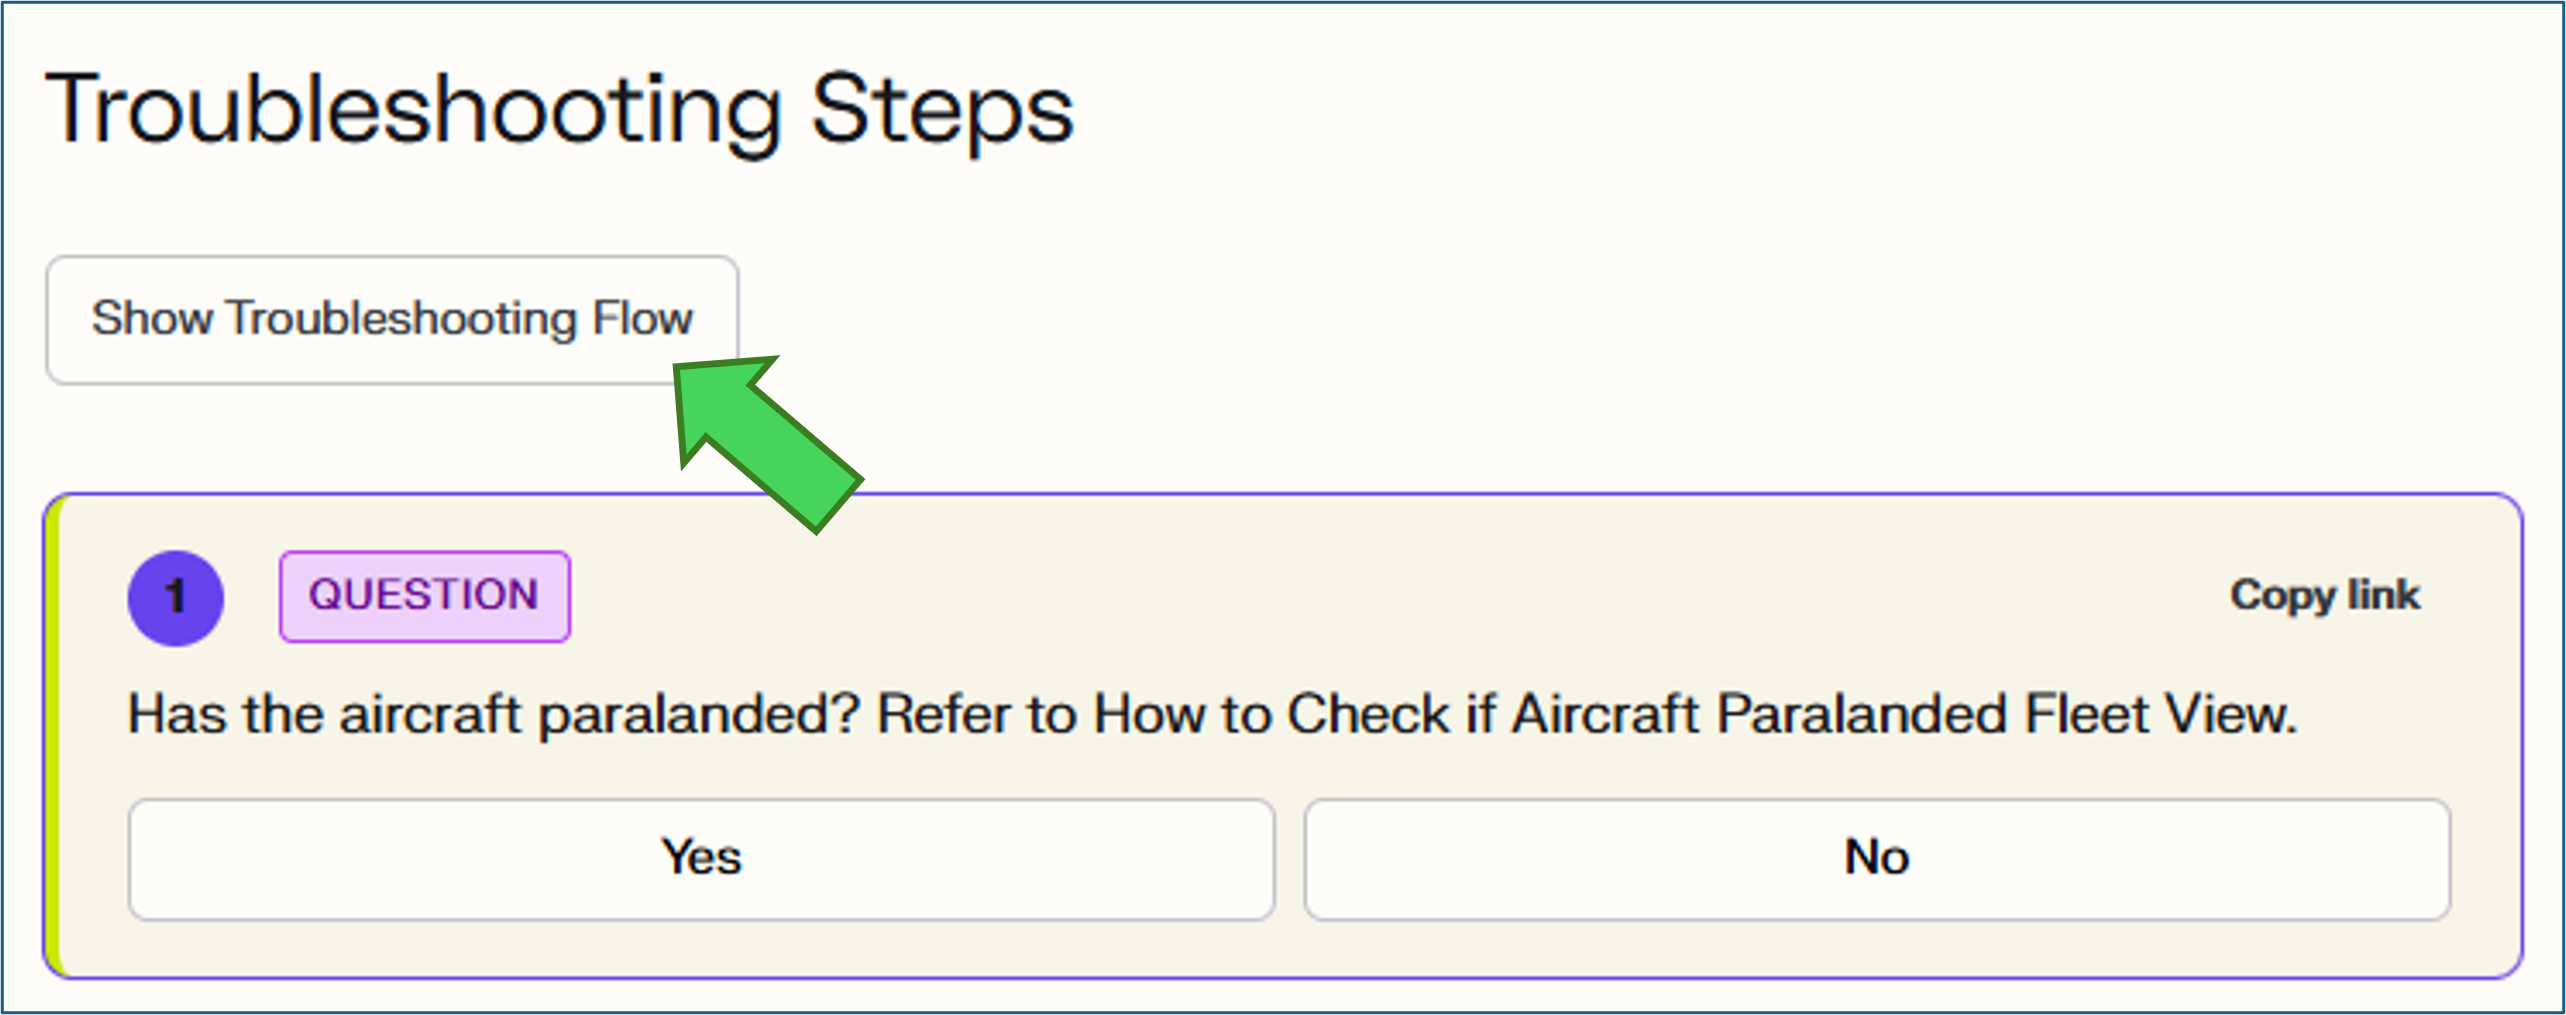
- On a troubleshooting topic, click Show Troubleshooting Flow.
- Hover over a block, or move keyboard focus to it, to preview its complete text.
- Click or tap a block to keep the preview open. If the step contains a link, you can open it from the preview.
- Click Expand to view the flowchart full screen. Drag to pan, and use the scroll wheel or toolbar controls to zoom.
- Close a preview with its close button, the
Esckey, or by clicking outside it.
When No Guide Exists
Section titled “When No Guide Exists”Check the Alarm Coverage Index to see which alarms are covered and which still need guides. If you encounter an alarm without a guide, follow No Troubleshooting Guide Standard Operating Procedure.
If you want to request missing coverage, use New Topics and General Requests. If you intend to author the missing guide, use Create a New Guide.
Access Required
Section titled “Access Required”You do not need GitHub access to use this guide. However, you need a GitHub account and write access to the ZiplineTeam/service_docs repo to suggest a change and to author a guide.
Open suggestions
There are no open suggestions.
Open pull requests
There are no open pull requests.