

Using ZipViz for Live Diagnostics
ZipViz Live streams real-time telemetry topics from a Smart Cart into Baraza so you can plot signals as they’re produced. The Log Data Bridge starts automatically on every Smart Cart. To use it, enter the cart’s short hostname in ZipViz, select a host, and subscribe to the topics you care about.
NOTE: ZipViz Live is for live plotting. For historical/log-replay plotting, use the regular Log Plots view in Baraza.
Connect ZipViz to the Smart Cart
Section titled “Connect ZipViz to the Smart Cart”-
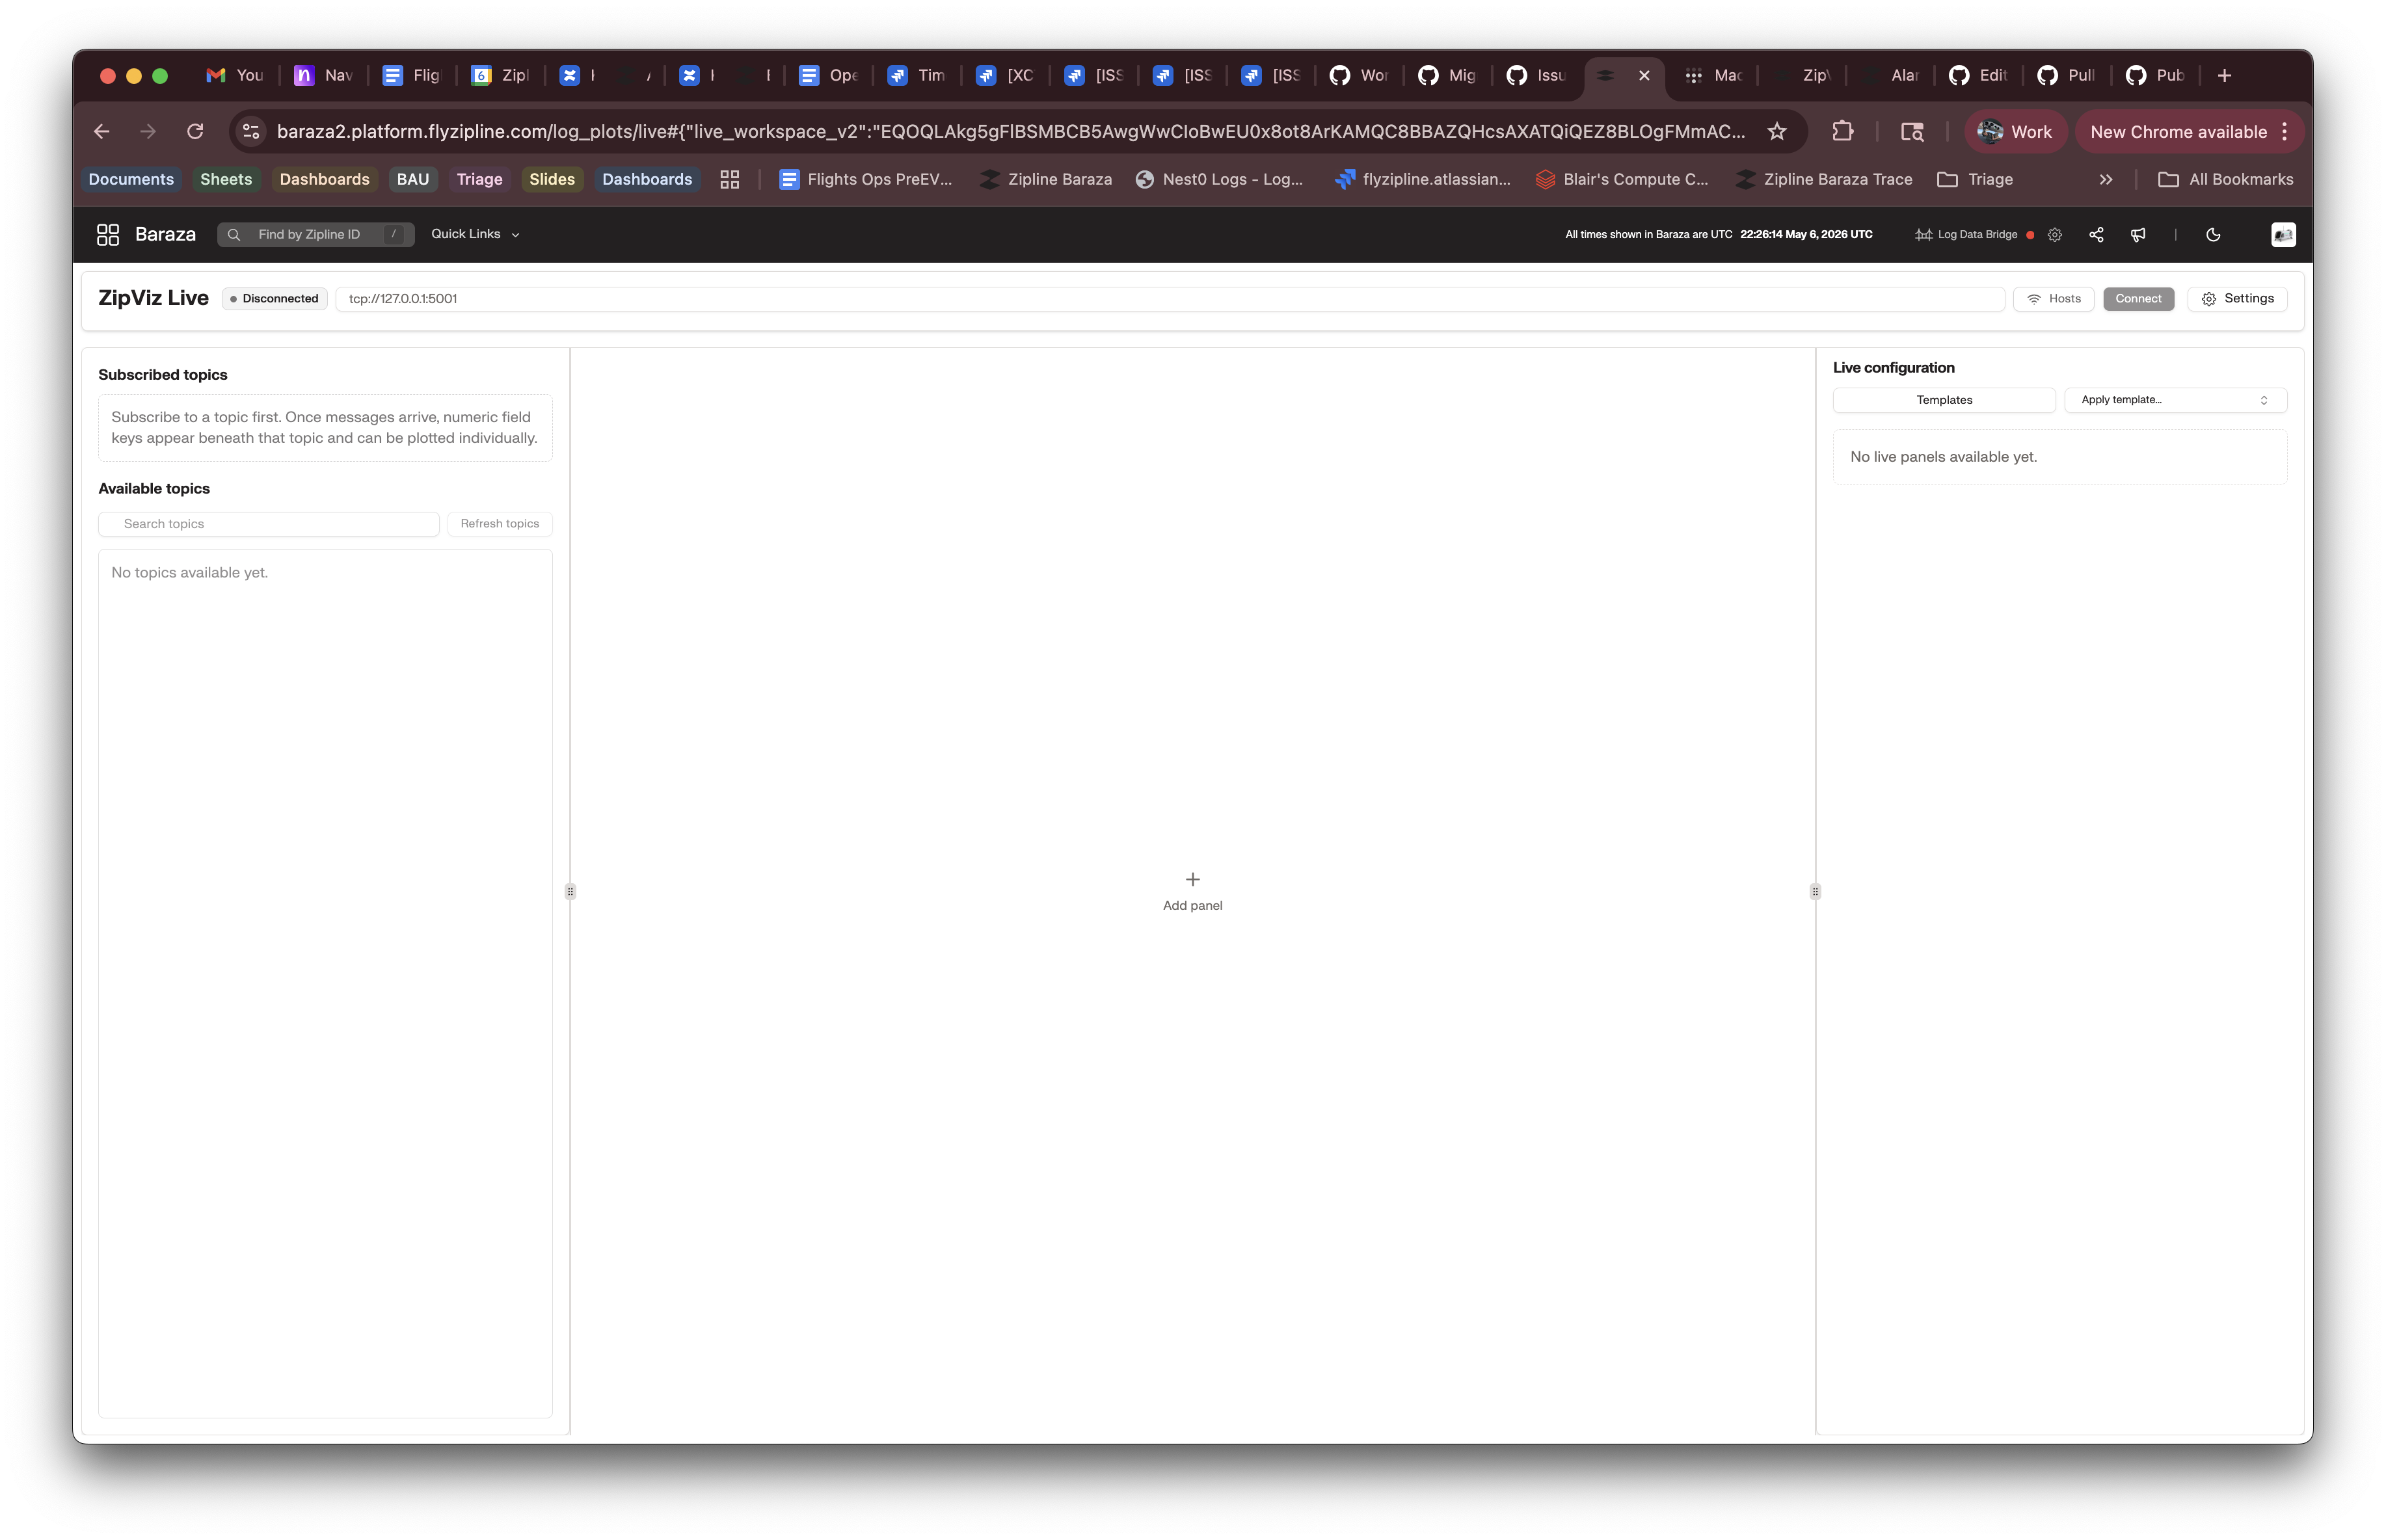
Open https://baraza2.platform.flyzipline.com/zipviz/live.
-
Click the Log Data Bridge settings icon at the top of the page.
-
In Address, enter the Smart Cart’s full short hostname, such as
p2-smart-cart-11, appended by Tailscale’s full domain nametailee8f.ts.netand confirm that Port is3030. ZipViz autocompletes the Connection URL for you. In this example, the Connection URL entry would complete to look like : https://p2-smart-cart-11.tailee8f.ts.net/api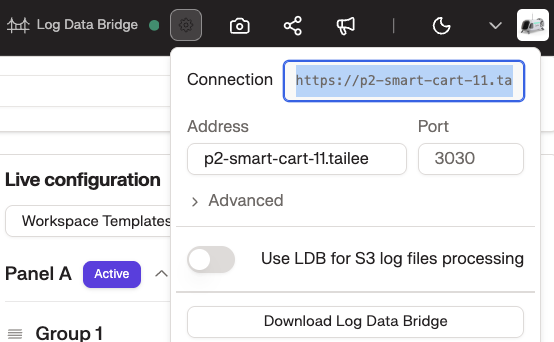
-
Verify the Log Data Bridge indicator turns green next to the icon.
-
Click Hosts at the top right and select the appropriate node from the menu. For most diagnostics this is
compute_a. -
Click Connect.
Plot live topics
Section titled “Plot live topics”-
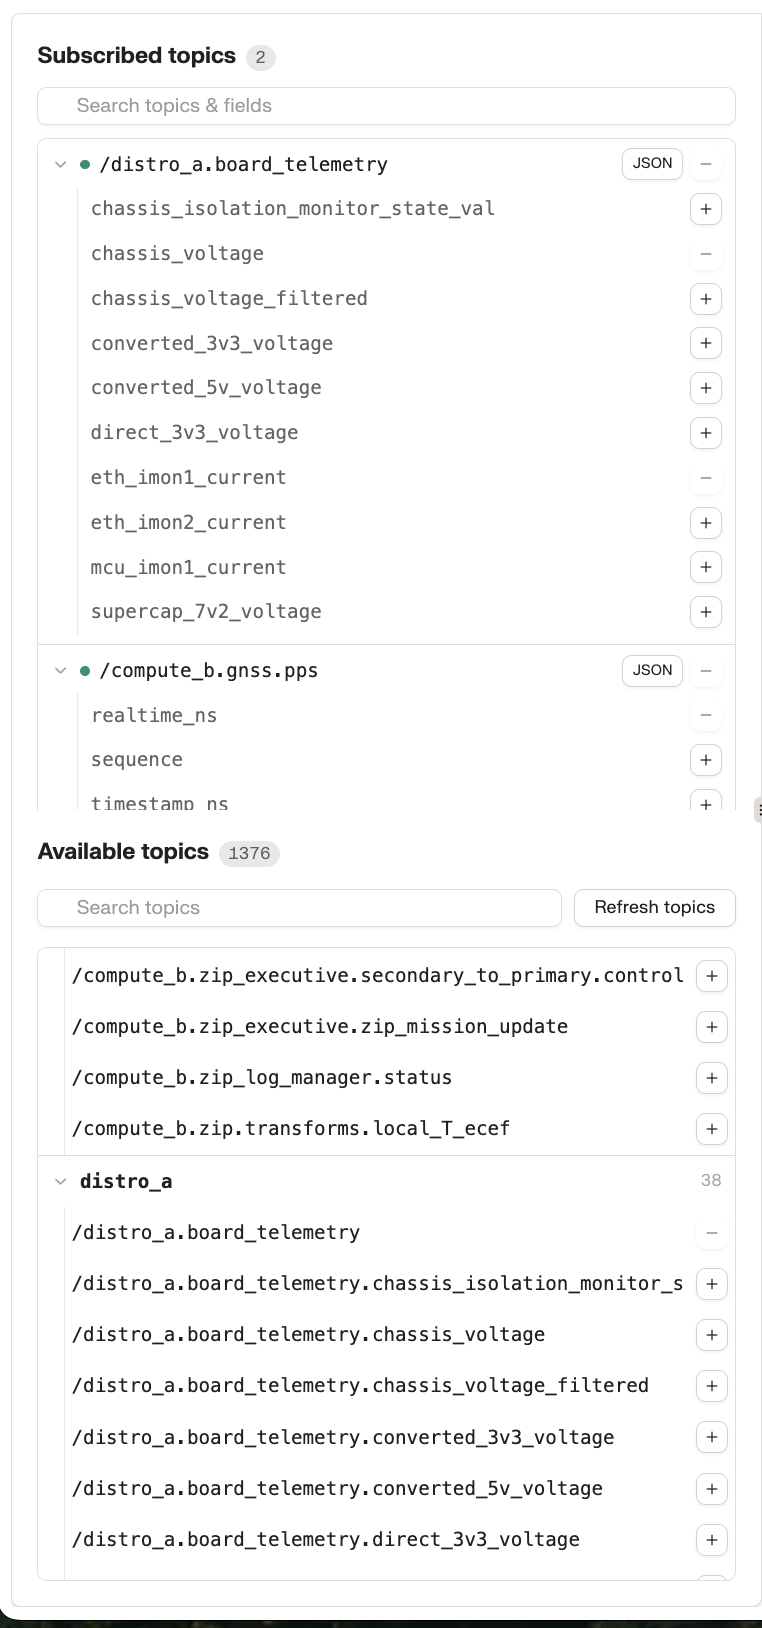
In the Available topics panel on the left, search for or scroll to the topics you want to plot.
-
Click the + next to each topic to subscribe. Subscribed topics show up in the Subscribed topics panel above with a JOIN indicator.
-
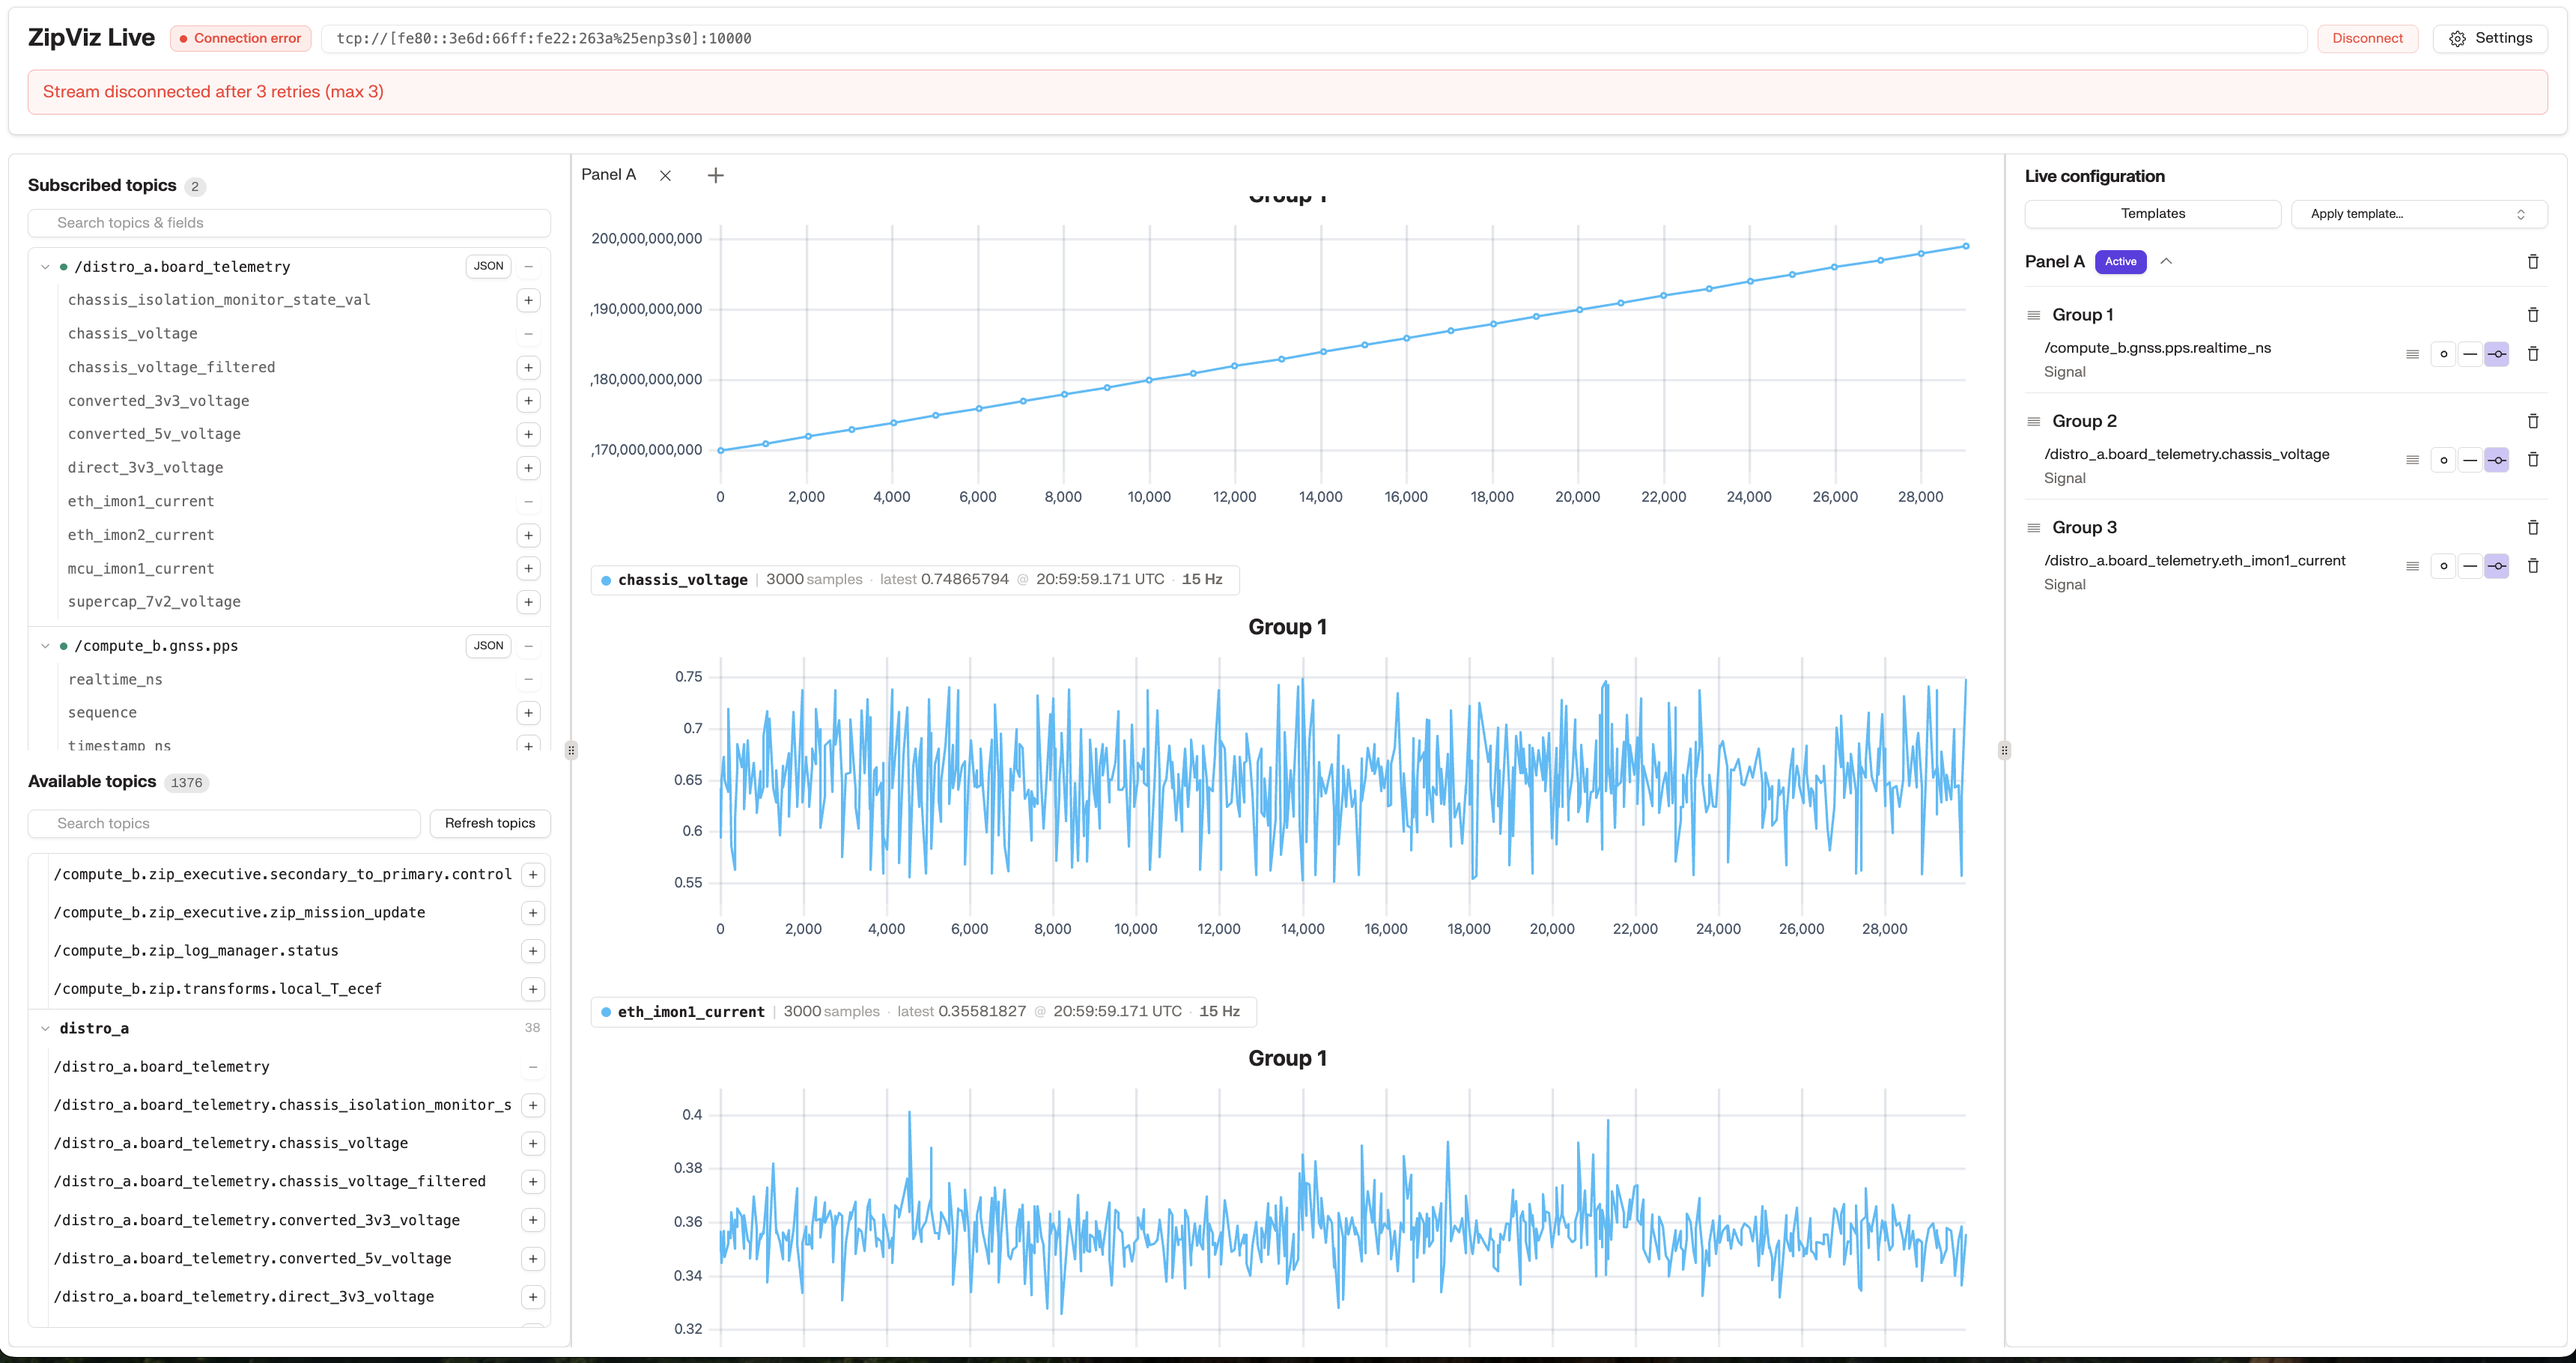
Drag a numeric field from a subscribed topic onto a panel on the right to start plotting it. You can group multiple fields onto the same panel for direct comparison.
- The disconnected indicator at the top of ZipViz turns green only after you’ve selected a host and clicked Connect. If Log Data Bridge does not connect, confirm that Address contains the Smart Cart’s full Tailscale hostname (for example,
p2-smart-cart-11.tailee8f.ts.net), that the generated Connection URL ishttps://p2-smart-cart-11.tailee8f.ts.net/api, and that Port is3030. - Live plots are not persisted. To save what you’re seeing, take screenshots or capture the underlying log span and re-plot from the regular Log Plots view.
- If you are not seeing any hover node topics, you may need to make sure power is turned on for all nodes
Example Live Panel Embedding for Troubleshooting Articles
Section titled “Example Live Panel Embedding for Troubleshooting Articles”Topic: This section is an example fixture for the live-mode telemetry-step feature described in planning/telemetry-live-step.md. It exercises the type: "telemetry" step with mode: "live": the technician enters a Smart Cart’s short hostname, such as p2-smart-cart-29, and the embedded ZipViz Live view opens predetermined panels.
p2-smart-cart-29; the embedded panels plot Hover Node Ethernet SQI metrics and should update live while the Hover Nodes are powered on.Did this guide help you get unblocked?
Open suggestions
There are no open suggestions.
Open pull requests
There are no open pull requests.